Mandefasa an'arivony fahaizana efa vonona ho an'ny Claude, Cursor, ary maro hafa.
Animated Data Visualizations Are Eating Static Charts in 2026
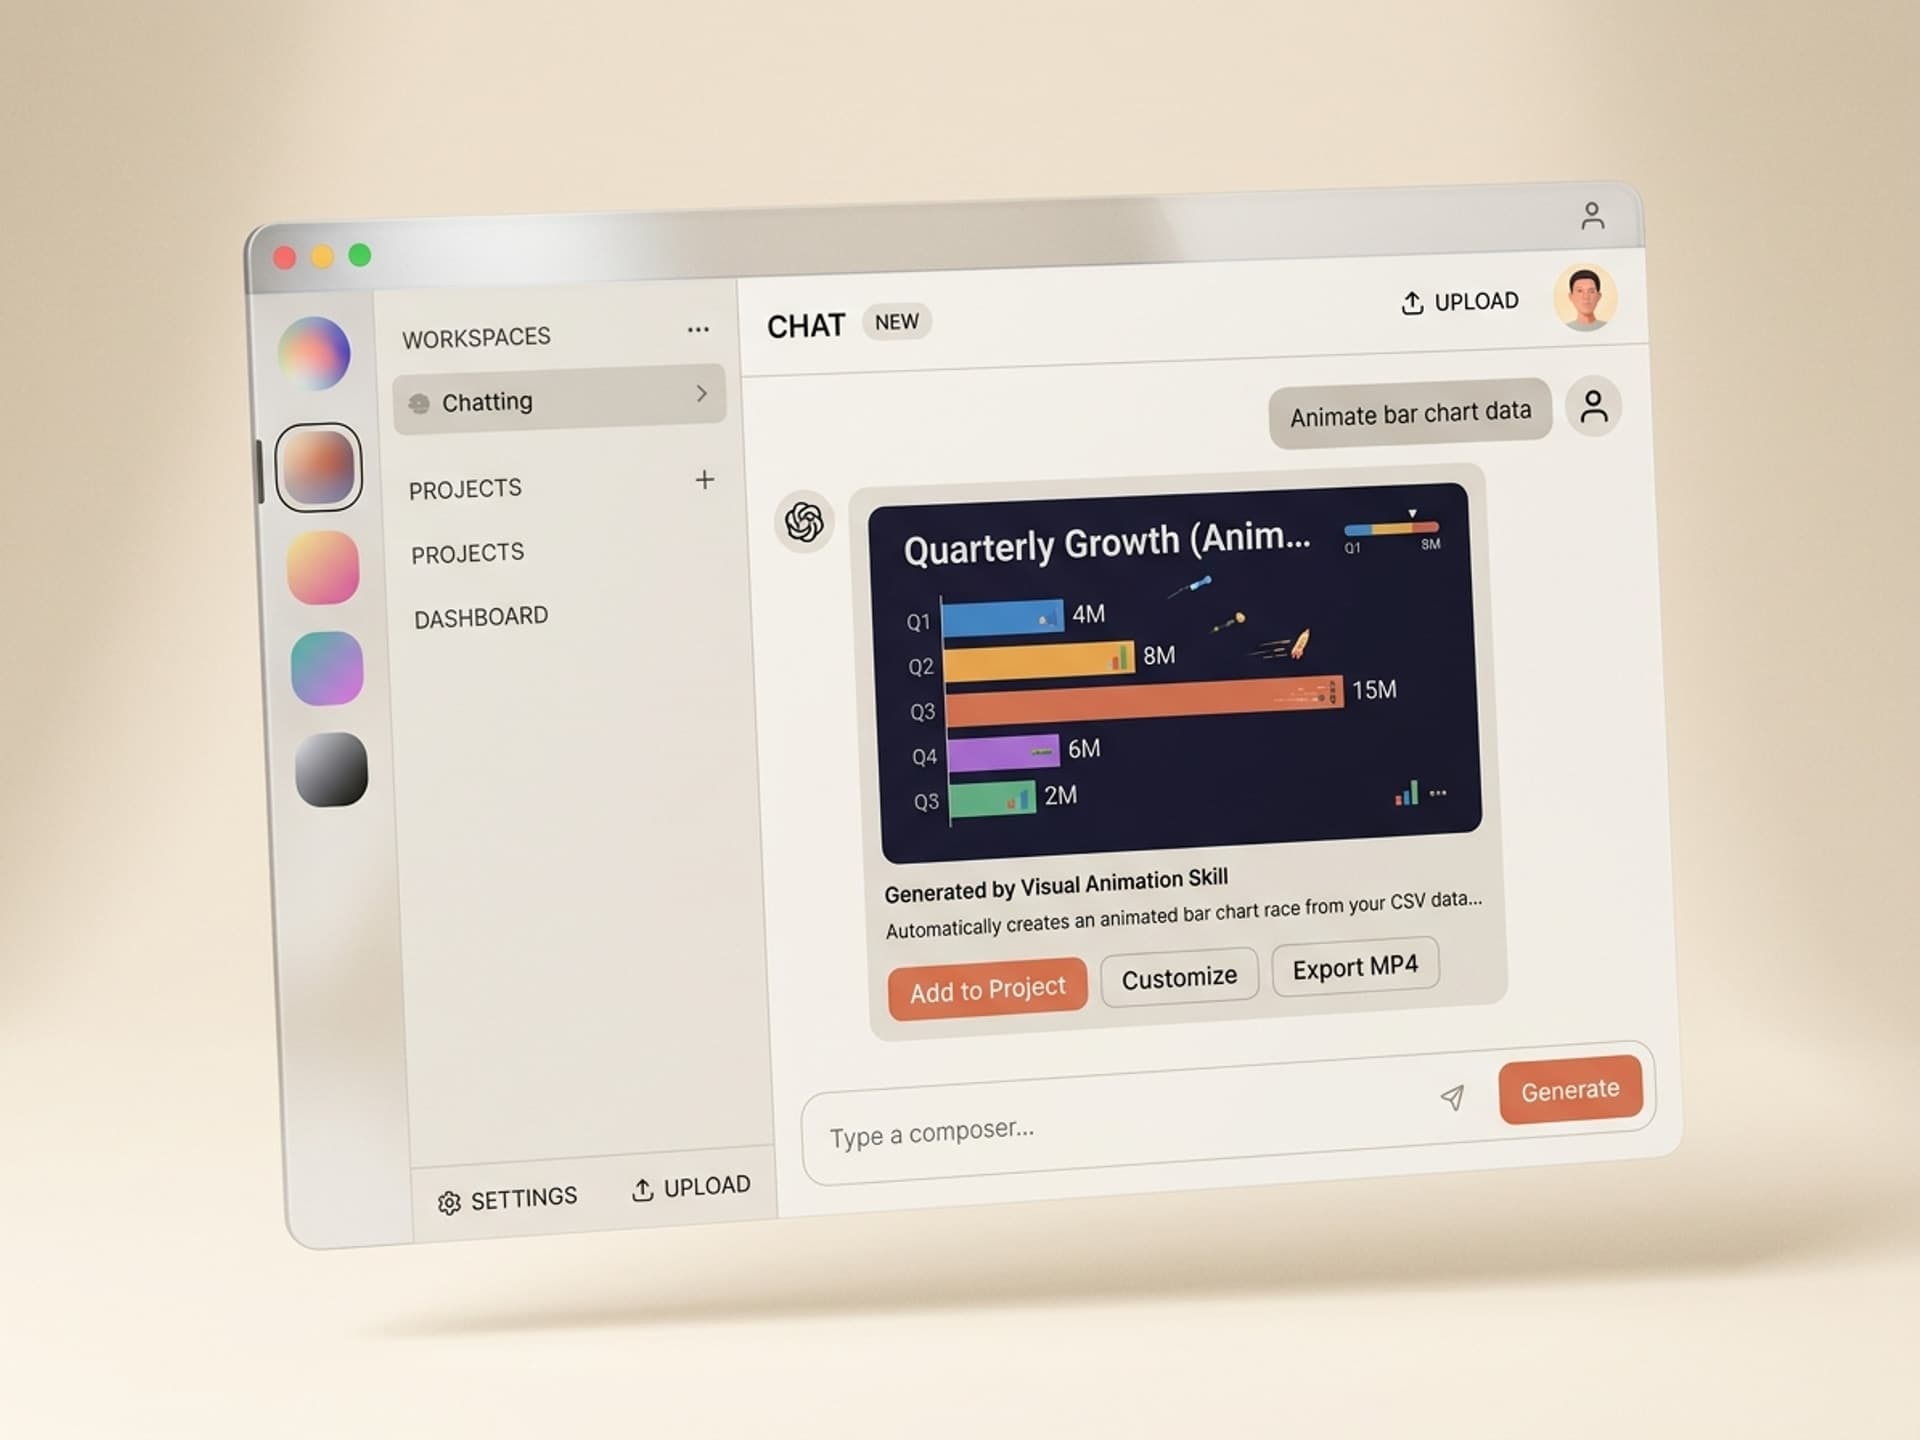
A static bar chart gets scrolled past in 0.8 seconds. An animated bar chart race holds attention for 24 seconds on TikTok and gets 5x more shares on LinkedIn. That gap is why every data journalist, marketer, and course creator is rushing to ship animated data viz - and why most of them quit after one weekend in After Effects. The rigging takes 6 to 14 hours per chart. With AI skills on Vibe Skills, the same chart ships in 10 minutes from a CSV file, with brand colors baked in.
This guide breaks down the 5 best AI skills for data viz animations on Vibe Skills, the 5 chart types that go viral, and a 10-minute workflow you can copy this week.
Mandefasa an'arivony fahaizana efa vonona ho an'ny Claude, Cursor, ary maro hafa.
Why Data Viz Goes Viral When Animated
Static charts are reference material. Animated charts are stories. The difference shows up in three places creators actually care about: watch time, shares, and saves.
- Watch time: a 15-second bar chart race holds 78% completion on Reels. A static chart gets swiped at 1.2 seconds.
- Shares: animated maps showing election shifts or COVID spread get 4 to 7x the share rate of static equivalents on X and LinkedIn.
- Saves: line-growth charts get 3x more saves on Instagram because viewers come back to study the trajectory frame by frame.
The science is boring but obvious: motion triggers attention, sequencing creates narrative, and narrative beats data. The Financial Times, Bloomberg, and The Pudding built entire newsrooms around this insight. Most solo creators can't afford that headcount, which is exactly the gap AI skills fill.
There's a second reason animated data viz is taking over right now. Short-form video platforms reward dwell time, and animated charts are dwell-time machines. A 12-second animated line chart literally cannot be parsed faster than its runtime - the viewer has to wait. That's a free retention boost the algorithm rewards.
Mandefasa an'arivony fahaizana efa vonona ho an'ny Claude, Cursor, ary maro hafa.
The 5 Animation Types That Actually Convert
Not every animation works for every dataset. Here's the lookup table for picking the right one.
| Animation type | Best for | Typical use case | Avg watch time |
|---|---|---|---|
| Bar chart race | Ranked categories changing over time | Top 10 brands by market cap, country GDP rankings, app store positions | 18 - 24s |
| Line growth reveal | Single metric over time, trend storytelling | User growth, revenue trajectory, stock price, follower count | 10 - 14s |
| Heat map / choropleth | Geographic or matrix data | Election results, weather, store density, COVID spread | 8 - 12s |
| Animated pie / donut | Composition shifting between two snapshots | Market share before/after, budget allocation, survey results | 6 - 9s |
| Infographic motion | Multiple stats with sequenced reveal | Annual reports, "year in numbers" recaps, product launch metrics | 22 - 30s |
Rules of thumb:
- Bar chart races and infographic motion are the long-form winners - use them when you have 20+ seconds of viewer attention.
- Line reveals and heat maps are the short-form winners - use them for 9:16 Reels and TikToks.
- Pie animations are the weakest performers solo, but pair brilliantly inside an infographic motion sequence.
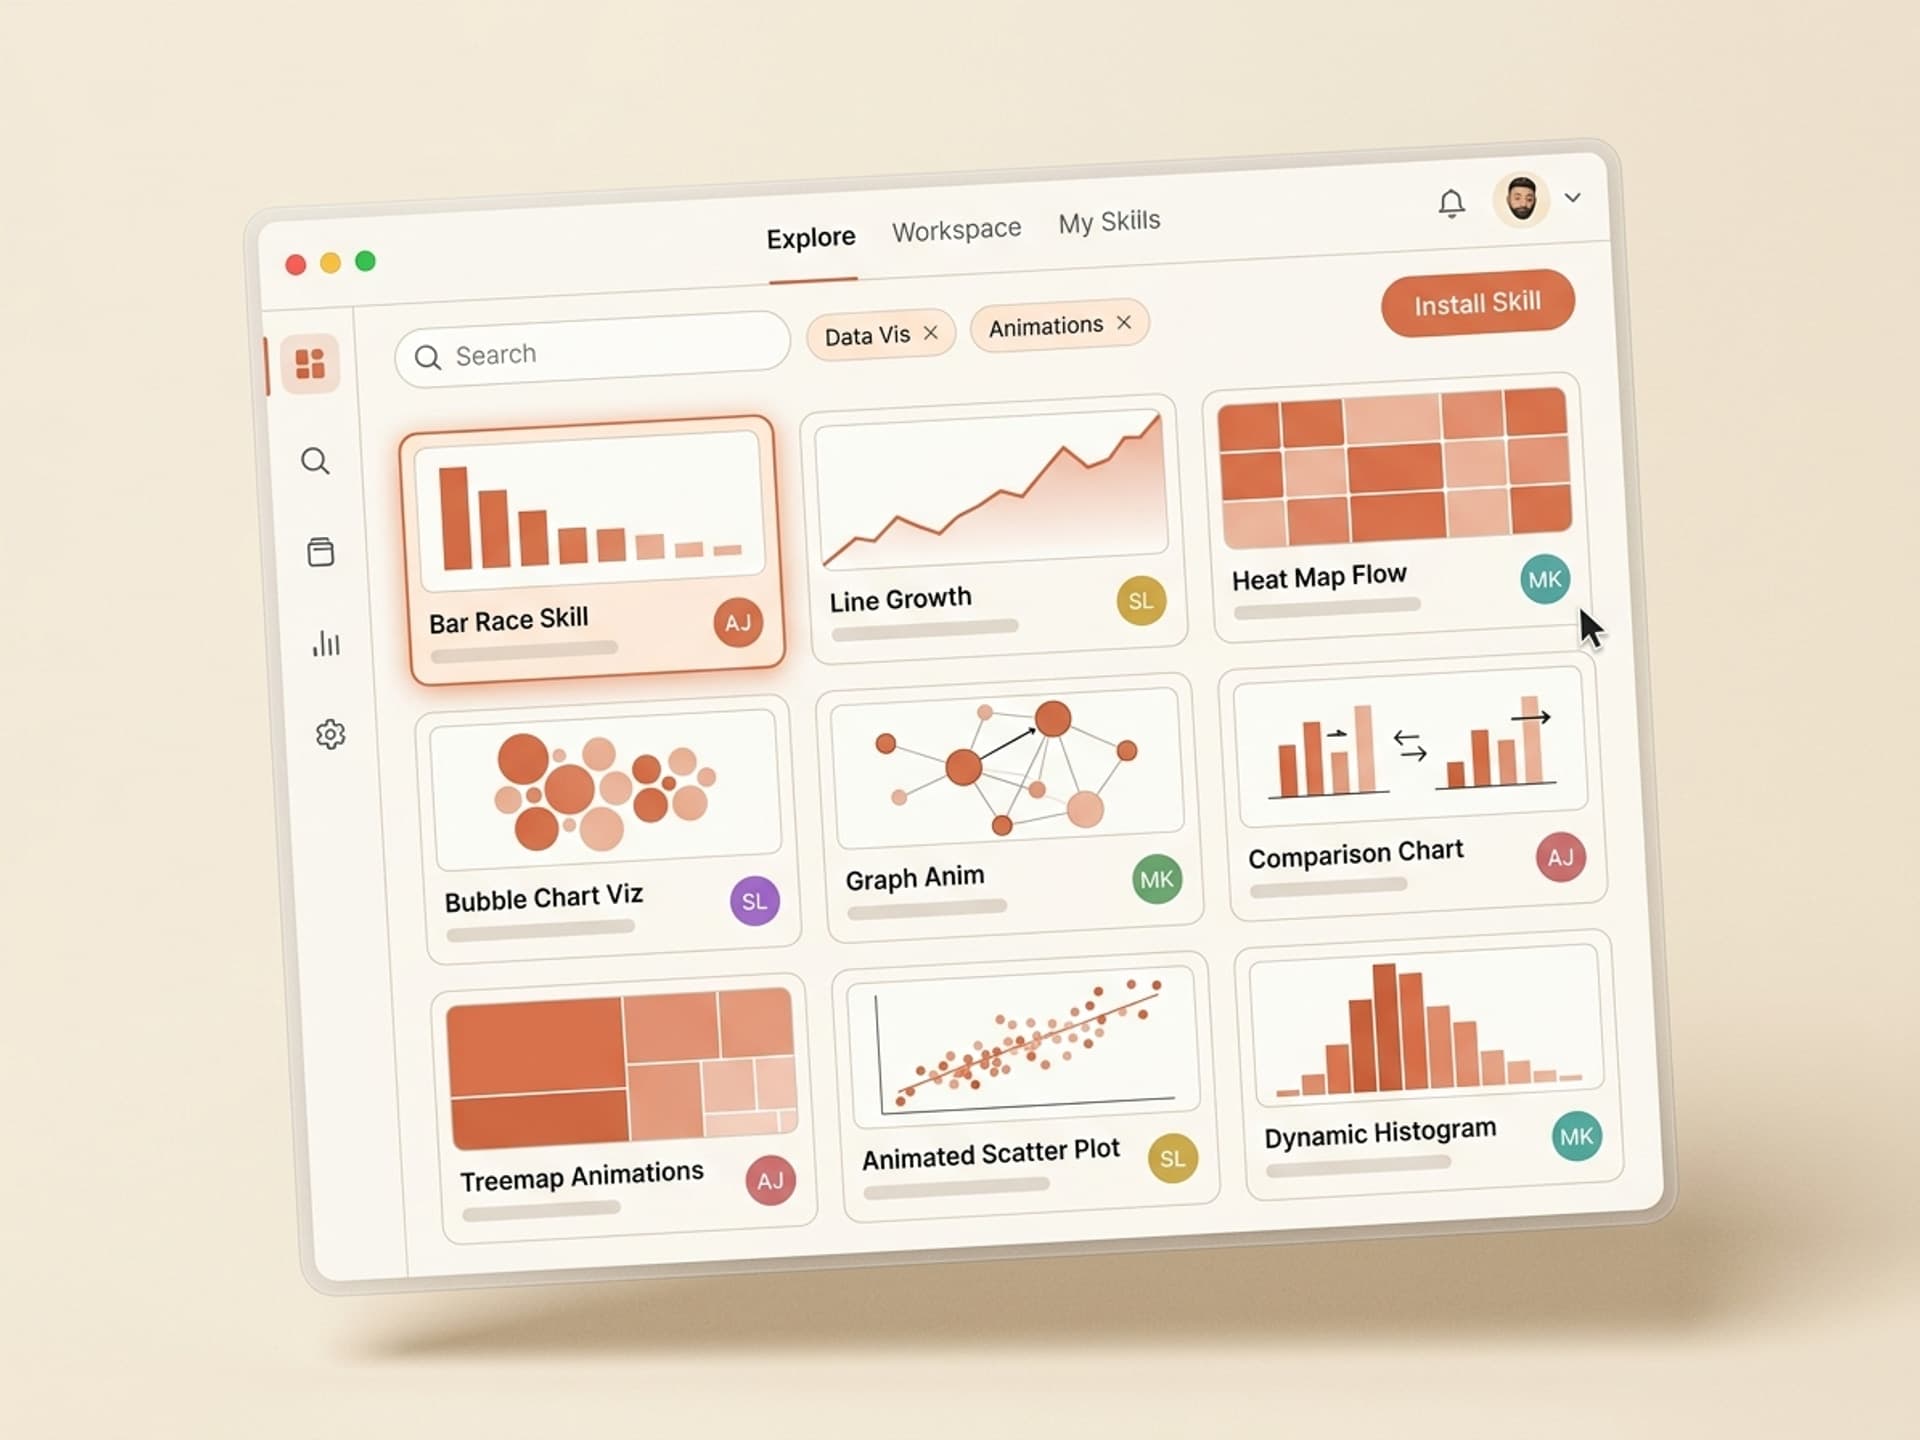
5 AI Data Viz Animation Skills on Vibe Skills
The Motion Graphics category on Vibe Skills has 30+ skills covering every animation type above. Here are the 5 that get installed most often by data journalists and creator marketers in 2026.
| Skill | Animation type | Output format | Best for |
|---|---|---|---|
| Bar Chart Race Generator | Ranked race | MP4 + Lottie + AE project | Brand rankings, country comps, leaderboards |
| Line Growth Storyteller | Animated line reveal | MP4 + Lottie | Revenue charts, user growth, fundraising decks |
| Heat Map Animator | Choropleth + radial heat | MP4 + SVG sequence | Geographic stories, election coverage |
| Infographic Motion Builder | Sequenced multi-stat reveal | MP4 + Figma source | Year-in-review, product launches, annual reports |
| Live Pulse Chart | Real-time updating line/bar | Lottie + JSON feed | SaaS dashboards, fintech apps, live streams |
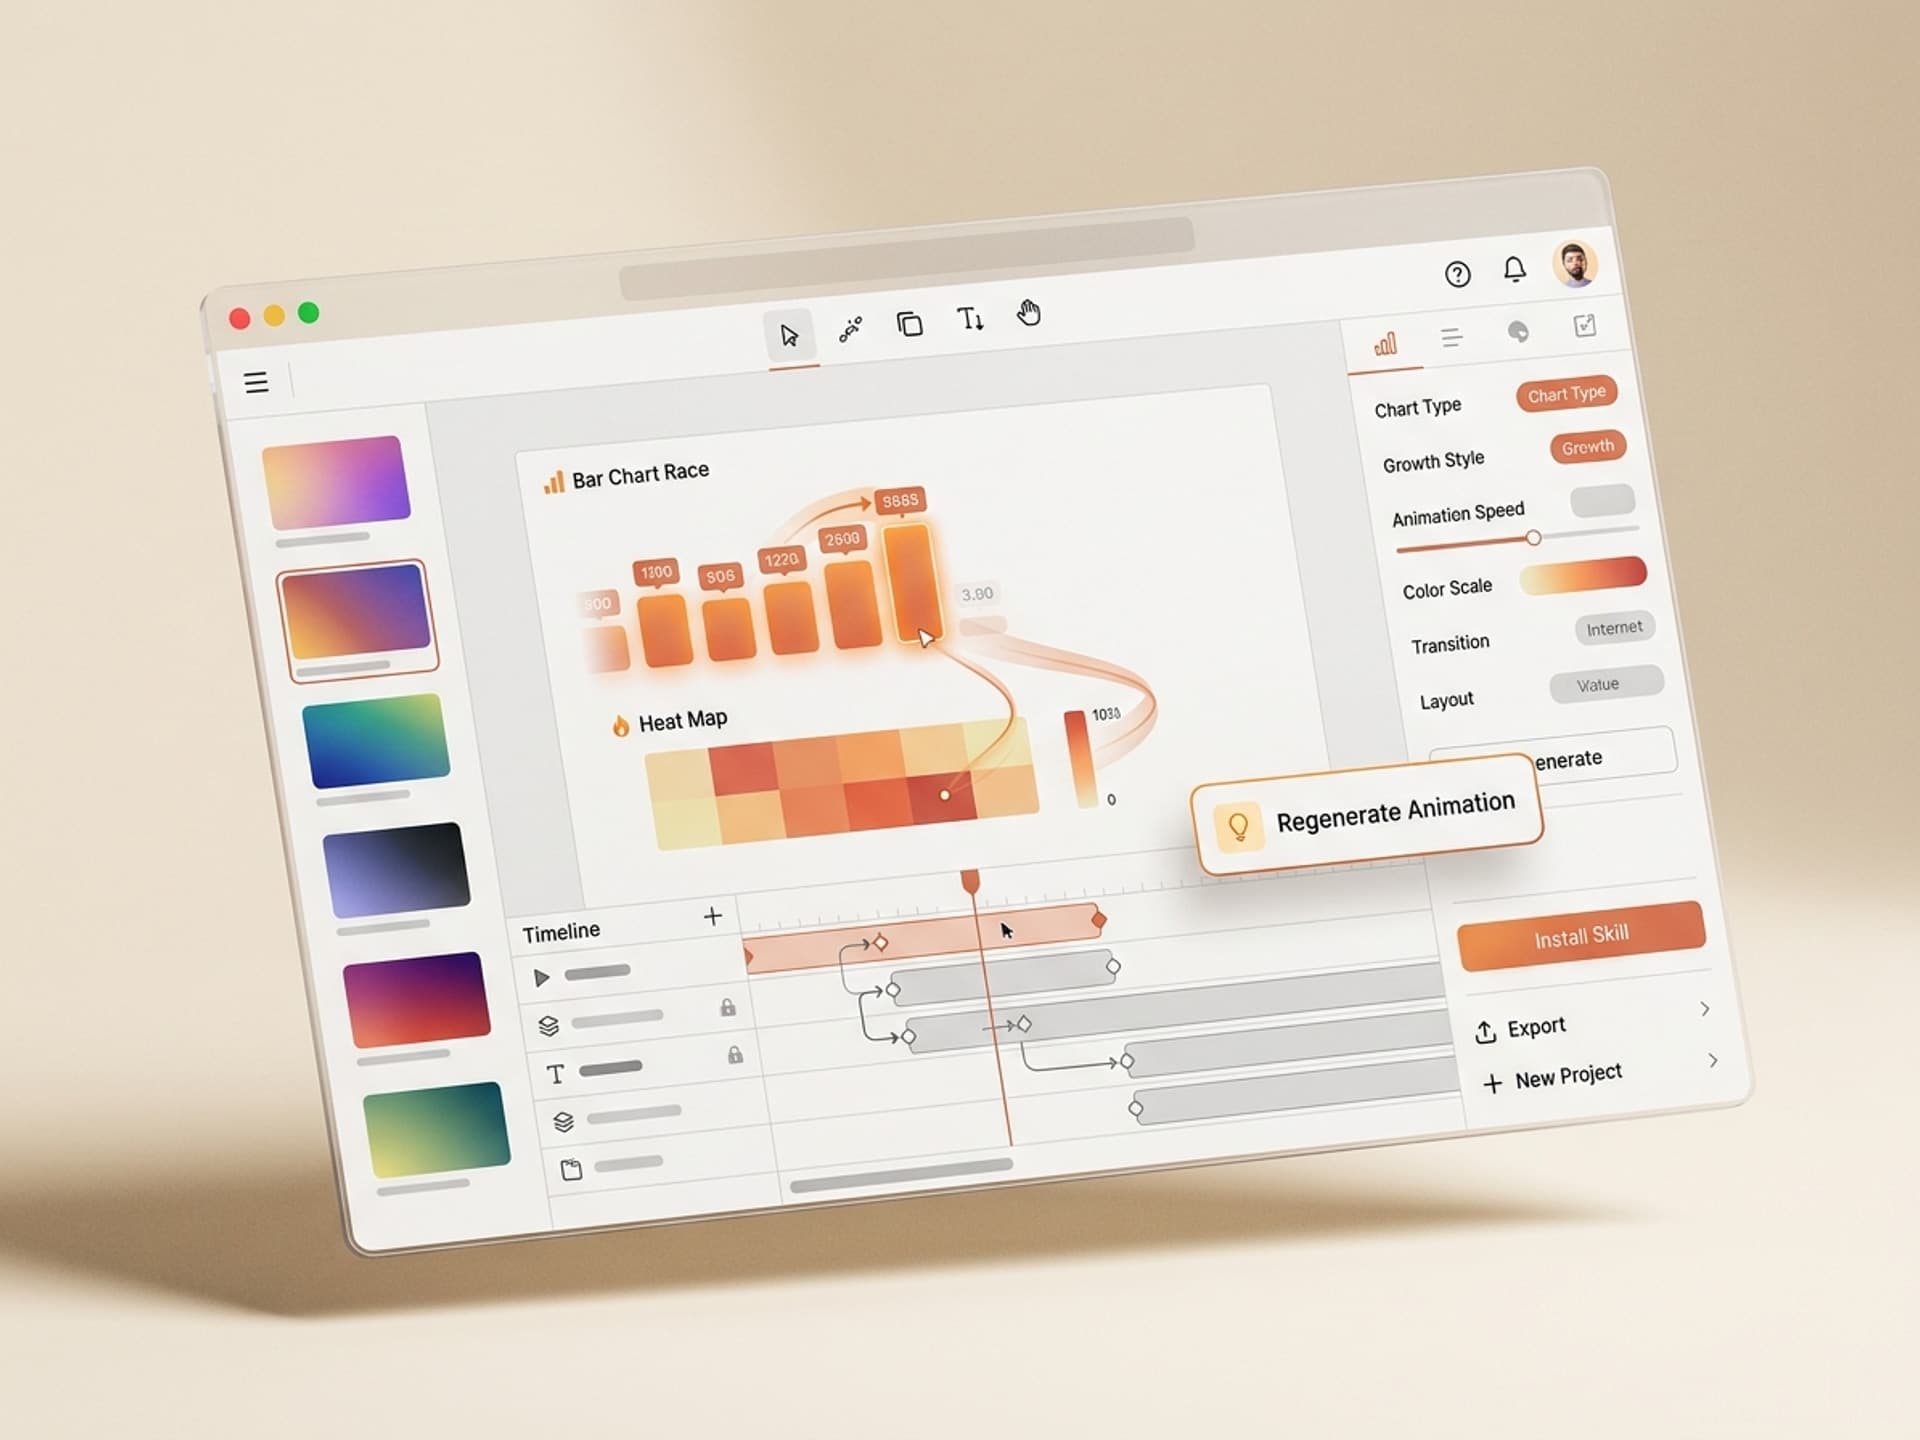
Each skill ships with a brand-color picker, a font sync to your Figma library, and one-click export to MP4 (1080p and 4K), Lottie JSON, and an editable After Effects project. The After Effects file matters - even non-motion designers want the option to tweak a single keyframe before publishing.
Browse all motion graphics skills on Vibe Skills →
The 10-Minute Data Animation Workflow
This is the workflow most creators land on after a few weeks. Steal it.
Step 1: Pick the right skill on Vibe Skills
Open the Motion Graphics category, filter by "Data Viz", and pick the skill that matches your animation type from the table above. Install takes one click - no setup, no plugins. The skill installs into your Claude or Manus workspace and is callable from there.
Step 2: Drop in your CSV or JSON
Every data viz skill on Vibe Skills accepts CSV (most common) or JSON (for nested or live data). The format is documented inside the skill, but for 95% of cases the rule is: column 1 is the entity (brand, country, date), columns 2 to N are the values per time step. Name your headers cleanly - the skill uses them as labels.
Step 3: Set brand colors and fonts
Paste your brand hex codes (3 to 5 colors) or link your Figma library. Pick a font from Google Fonts or upload a .ttf / .otf. The skill auto-applies these across every frame, axis label, and data point.
Step 4: Choose duration and pacing
Standard durations:
- Reels / TikTok / Shorts: 9 to 15 seconds
- LinkedIn / X feed posts: 18 to 24 seconds
- YouTube intros / explainers: 25 to 40 seconds
- Investor decks / annual reports: 30 to 60 seconds
Pacing presets ("aggressive", "smooth", "documentary") control easing and dwell time on each data point. Documentary pacing is the safest default for fact-heavy stories.
Step 5: Generate, review, ship
The skill renders in 60 to 180 seconds depending on chart complexity and resolution. You get an MP4 preview, a Lottie file for web embedding, and an AE project for tweaks. Most creators ship the MP4 directly - no editing needed in 8 out of 10 cases.
Total time: 8 to 12 minutes for a chart that would take 6 to 14 hours to rig manually in After Effects.
Manual After Effects vs AI Skill: The Real Time Cost
This table is what gets people to stop building from scratch.
| Task | Manual After Effects | AI skill on Vibe Skills |
|---|---|---|
| Set up project, comp, color palette | 30 - 45 min | 0 min (preset by skill) |
| Import + clean CSV data | 20 - 40 min | 30 sec (drag-drop) |
| Rig animated bars / lines / shapes | 3 - 6 hours | 0 min (skill handles it) |
| Sync to brand colors + typography | 30 - 60 min | 1 min (paste hex codes) |
| Add labels, axis, legend animations | 1 - 2 hours | 0 min (auto) |
| Render + export to MP4 + Lottie | 20 - 40 min | 60 - 180 sec |
| Total per chart | 6 - 11 hours | 8 - 12 minutes |
A creator producing 4 charts a week saves 24 - 44 hours every week. At a freelance rate of $50/hour that's $1,200 - $2,200 in recovered time, against a Vibe Skills Pro subscription at $29/month annual with unlimited skills.
What About Flourish, Datawrapper, Tableau?
Reasonable question. Here's how the alternatives stack up.
| Tool | Strengths | Where it falls short |
|---|---|---|
| Flourish | Fast bar chart races, embeddable on web | Locked to Flourish branding on free tier, no editable AE source, limited animation types |
| Datawrapper | Excellent for static charts and journalism | Animation support is minimal, mostly built for embeds not video |
| Tableau | Enterprise BI, drill-down dashboards | Not a video tool - exports static frames, animation requires manual screen recording |
| After Effects + plugins | Full creative control | 6 - 14 hours per chart, requires motion design skills |
| Vibe Skills | Brand-consistent video output, AE project included, 10-min workflow | Subscription required, animation styles fixed to skill presets |
Where each wins:
- Flourish if you only need a web embed and don't care about brand consistency.
- Datawrapper if you're a journalist publishing in print or on a web article.
- Tableau if you're a BI analyst, not a creator.
- AE + plugins if you have 14 hours and a paid motion designer on staff.
- Vibe Skills if you ship 1+ animated chart per week to social, video, or decks and want it to match your brand without rigging from scratch.
Real Use Cases (and Which Skill to Install)
| Use case | Recommended skill | Output |
|---|---|---|
| Crypto analyst posting weekly token rankings | Bar Chart Race Generator | 24s MP4 for X + LinkedIn |
| SaaS founder sharing ARR growth | Line Growth Storyteller | 12s MP4 for Twitter + 30s version for board deck |
| Election night live coverage | Heat Map Animator | Live-updating choropleth via Lottie |
| Fintech app onboarding screen | Live Pulse Chart | Embedded Lottie animation |
| Year-in-review post | Infographic Motion Builder | 30s MP4 for IG Reels + LinkedIn |
| YouTube explainer about market shifts | Bar Chart Race + Line Growth combo | 45s sequence inside a longer video |
Pick the right skill on Vibe Skills →
Frequently Asked Questions
What CSV format do data viz skills accept?
Standard CSV with headers. Column 1 is the entity (country, brand, date), columns 2 to N are values per time step or category. Header row is required because the skill uses it for labels. Most skills also accept JSON for live data or nested structures. Full format docs ship inside each skill on Vibe Skills.
Can I auto-apply my brand colors and fonts?
Yes. Every data viz skill in the Motion Graphics category accepts a brand color palette (3 to 5 hex codes) and a font file or Google Font name. The skill applies them across every chart element, label, and axis. You can also link a Figma file and the skill pulls colors and type styles from there.
What export formats do I get?
MP4 at 1080p and 4K (the social default), Lottie JSON for web and app embeds, an editable After Effects project for tweaks, and an SVG sequence for high-res print. Some skills also export GIF for legacy email clients. All formats ship in a single render - no need to re-run.
Do I need After Effects installed?
No. Vibe Skills renders the MP4 in the cloud and delivers it ready to upload. The After Effects project file is included as a bonus for designers who want to tweak a keyframe, but it's not required to publish. Most creators ship the MP4 directly.
How long does each chart take to render?
60 to 180 seconds depending on chart complexity and resolution. A 15-second bar chart race at 1080p typically renders in 90 seconds. A 60-second infographic motion sequence at 4K renders in around 4 minutes. The skill emails you when it's done - no need to babysit the tab.
Can I update a chart with new data without re-rigging?
Yes. The "Live Pulse Chart" skill on Vibe Skills connects to a JSON feed and re-renders on demand. For other data viz skills, you re-upload the CSV with the new values and the skill keeps your existing color palette, font, and pacing settings. Re-render takes the same 60 to 180 seconds.
Is this only for advanced motion designers?
No - the opposite. The whole reason these skills exist is so non-designers can ship designer-quality animations. If you can drag a CSV and pick three brand colors, you can ship a chart that looks like Bloomberg made it. Browse the Motion Graphics category to preview real outputs.
Stop Rigging Charts. Start Shipping Stories.
Animated data viz is the difference between a 0.8-second scroll-past and a 24-second hold. Manual After Effects gets you there in 6 to 14 hours per chart. AI skills on Vibe Skills get you there in 10 minutes, with brand colors baked in and an editable AE file as a bonus.
If you produce 4 charts a week, this is 24 to 44 hours of your life back, every week, for the cost of a single coffee shop tab per month.
Browse data viz animation skills on Vibe Skills →
The next chart you publish should hold the scroll. Install a data viz skill on Vibe Skills and ship it before lunch.